
Many investors that are new to dividends tend to focus primarily on a stock’s dividend yield. This often leads to yield chasing, where an individual ignores factors such as payout ratio, dividend growth rate, and even company revenue growth in favor of buying whichever stocks pay the most right now. In this post, we’re going to look at the compounding power of high dividend growth stocks, and how even with a lower yield you can generate more income in the long run.
I’m going to be using Home Depot (HD) and Verizon (VZ) to illustrate the difference between dividend yield and growth, but the focal point is not these particular companies. This comparison is not about which stock is the better investment, as we are only going to look at their past performance.
HD vs VZ – 10 Years of Dividends
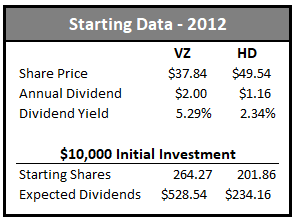
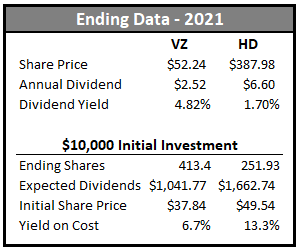
Let’s start by looking at each company’s dividend status in 2012. At the beginning of the year, VZ had a share price of $37.84 and annual dividend of $2.00 per share. This gives VZ a starting yield of 5.29%. On the other side, HD was trading at a share price of $49.54 with an annual dividend of $1.16. This gives HD a starting yield of 2.34%. Based on a $10,000 initial investment, we get 264.27 shares of VZ and 201.86 shares of HD.
For this post we are going to reinvest dividends (DRIP) at the end of each quarter and are going to ignore taxes for simplicity. Verizon pays out in February, May, August, November and Home Depot pays out March, June, September and December. I didn’t use the exact dividend payout dates but the weekly prices should be close enough. We are going to analyze from the beginning of 2012 until the end of 2021.
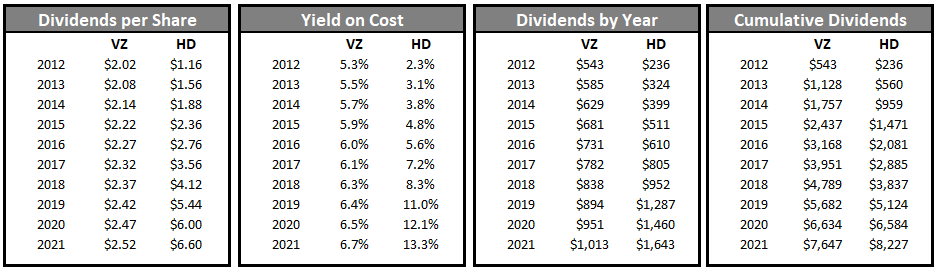
After compiling the data, the following chart shows the annual dividends paid out by each stock by year. VZ is the blue (first) set of lines, and HD is the orange (second) set of lines.
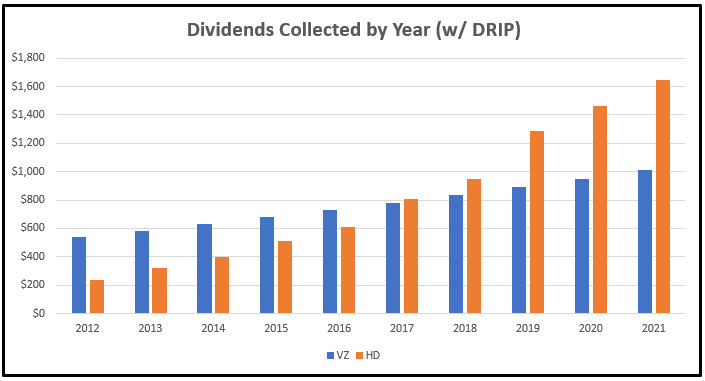
As we can see, HD starts off paying approximately half as many dividends as VZ. However, by 2017 HD has surpassed VZ in annual dividends and by 2019 HD is paying considerably more dividends. In 2012, VZ would have paid $542.74 in dividends and HD $236.16. However, over this 10-year span HD increased its dividend at an average rate of 21.31% while VZ only increased it at an average rate of 2.53%.
But what if we summed up the dividends each year and compared the totals collected over time? Given that VZ is paying more dividends for the first several years, perhaps the end result is different when we add everything up. The following chart illustrates that comparison.
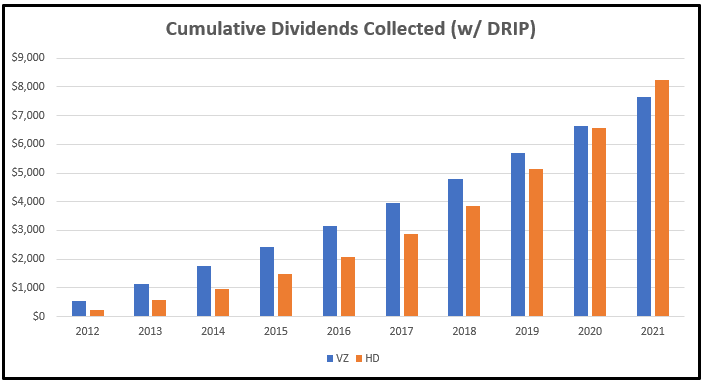
Surprisingly, HD still comes out ahead in the end. In this comparison the numbers were much closer, thanks to the higher starting dividend yield of VZ. VZ’s higher dividends in the earlier years gave it the chance to build up a bit of a lead. However, HD’s dividend growth enabled it to catch up and surpass VZ in the 10th year. In theory, this means anyone with an investing time horizon of 10 or more years would have been better off buying HD instead of VZ if dividend income was their end goal.
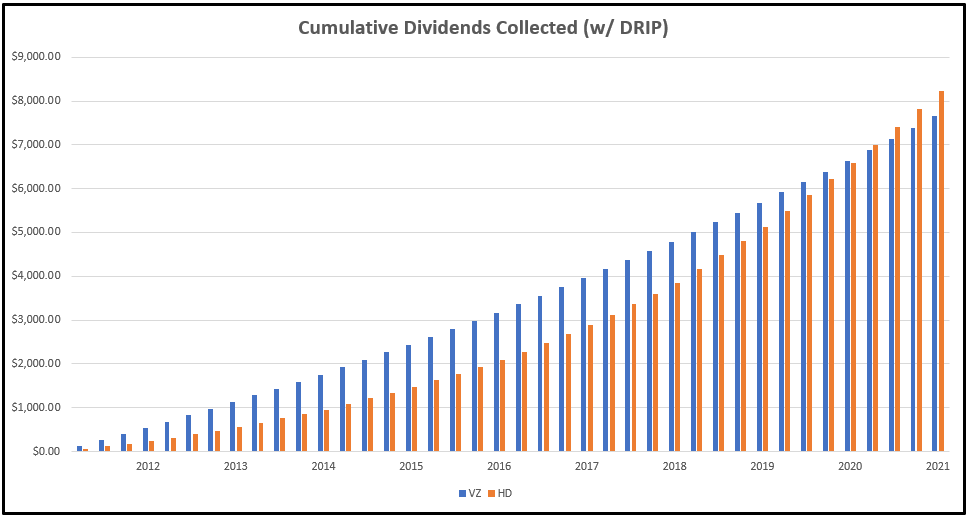
The following chart is the same data as the cumulative dividends above except broken down on a quarterly basis. The VZ dividends appear to grow at a linear rate while the HD dividends are closer to an exponential growth rate.
Comparing Stock Performance
Despite VZ starting off with a 5.3% yield and HD starting off with a 2.34% yield, the 21.31% CAGR from HD enabled it to generate more income than VZ in the end. We can track the yield on our initial investment by taking the dividend paid in the latest year and dividing it by our initial cost per share. With HD we are now receiving $6.60 per share divided by our initial share price paid of $49.54. This gets us a yield on cost of 13.3%. With VZ we are now receiving a dividend of $2.52 and initially paid $37.84 per share. Our yield on cost for VZ is 6.7%.
While some investors feel yield on cost is a meaningless metric (since you could just sell a low yielding stock for a higher yielding stock), I think it has its value. It’s obviously not an indicator of future performance, but it can be an indicator of how well your stocks have done historically. If you bought a stock with a 2% yield and after 10 years the yield on your initial investment is now 10%, that would likely be an indicator that you invested in a high quality and strong cash flow generating business.
Keep in mind that our comparison doesn’t even factor in share price growth. Over that time HD went from $49 to $388 whereas VZ only went from $38 to $52. When just looking at the dividends and yield on cost, we can see that investing in HD would have been a much greater decision for dividend investors holding for 10+ years.
Future Performance Expectations
Moving forward from here, I think it’s likely that HD continues to grow its dividend at a high rate. Perhaps not 20% per year, but strong annual increases are still possible. In fact, for 2022 they just recently announced they would be raising their dividend another 15.2%. Given VZ’s low overall growth and high debt, I think a 2% – 2.5% growth rate is reasonable to expect going forward.
I created a table estimating future dividend growth for each stock. For HD I’m stepping the dividend down each year as the free cash flow payout ratio increases and sales growth slows. For VZ I am keeping it constant at a rate that is actually a little higher than their 3-year and 5-year CAGRs.
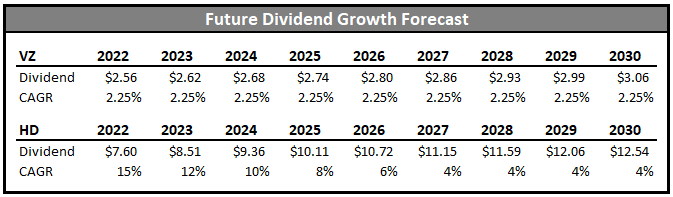
The end result is that HD’s lead continues to widen, even with the slowing dividend growth. Using today’s share counts, we could expect annual dividend income of $3,159 for HD and $1,265 for VZ. Of course, in reality we would expect more if we were still reinvesting our dividends each quarter.
Keep in mind that in this example shares of HD were originally purchased at $49.54 in 2012. This means that out in 2030 the yield on cost for our initial investment is 25.3%. When you hear about Warren Buffet collecting 50% of his initial Coca-Cola investment in dividends each year, dividend growth and holding for multiple decades was how he achieved such a feat. While in our example we aren’t at 50%, in 2030 we would have collected over $3,100 in dividends compared to our $10,000 initial investment. And that doesn’t even include any of the dividends received for prior years.
Past Performance =/= Future Performance
It’s important to remember that past performance does not guarantee future results. A stock having a dividend CAGR of over 20% in a 10-year span is a rare occurrence. Other than Home Depot, a few stocks that come to mind are AbbVie, Broadcom, Lowe’s, Texas Instruments, UnitedHealth, and Visa. But in a market of thousands of stocks, it’s a small sample size overall (I’m sure there are others I didn’t mention). Plus, this dividend growth took place during one of the best bull markets of all time.
There’s no way to know for sure whether a company will perform well enough to generate similar dividend growth. But by searching for quality businesses that generate strong cash flow, we can at least increase our odds.
In the case of HD and VZ, both actually have similar dividend payout ratios. However, VZ has much more debt and has had much slower revenue growth. All of these factors are important to consider when making an investment choice – not just the dividend yield or dividend growth rate. When analyzing stocks that pay a dividend, it’s important to determine whether or not the company has the cash flows to sustain paying the dividend and how much excess cash they are generating to raise the dividend.
Investing Time Horizon
It’s also important to consider your investment time horizon. If you are 10 years or less from retirement, stocks with higher yields may be the better choice. However, if you’re young with a 20- or 30-year investing timeline, companies that offer potentially high dividend growth may provide superior long-term returns. Everyone’s situation is different, and therefore all factors specific to your own lifestyle and investing goals needs to be taken into consideration.
Summary
When looking for dividend paying stocks, it’s important to consider the dividend growth rate in addition to the dividend yield. A stock with a lower yield and higher growth can eventually surpass a stock with a higher yield and lower growth in dividend income. However, these metrics alone shouldn’t be the deciding factor when purchasing a stock. Revenue and cash flow growth, the industry the company operates in, and the state of its balance sheet are all factors that should be considered as well.
Hopefully the example used in this post helps shed some light onto why I personally search for high dividend growth stocks. I have a multi-decade time horizon, and try to focus on stocks that will provide high dividend income down the road as opposed to right now. Keep in mind that while this post uses HD and VZ to serve a point, its not a reflection of whether either stock makes a good investment. It’s easy to cherry pick a historical example. Finding stocks that will provide equivalent future results is much harder.
Disclosure: I have a beneficial long position in HD. I wrote this article myself, and it expresses my own opinions. I am not receiving compensation for it. I have no business relationship with any company whose stock is mentioned in this article. Always do your own due diligence before making investment decisions or putting capital at risk in the market.